Test record: I measured the pinned DeepSeek V4 Flash 0731 target on the GMKtec EVO-X3 host named
evox3, an AMD Ryzen AI MAX+ 395 system with 128GB physical memory, using ROCm 7.14.0. A sparse four-expert experiment processed 32,512 prompt tokens at 146.65 tok/s, 10.06 times the first working configuration, and completed a one-pass 130,816-token run at 110.22 tok/s. Repeated requests were not answer-stable, so I did not deploy that fast path as the default. The exact production profile then completed a 4.09-hour, fully saturated 32K soak with no observed progressive leak signal, performance decline or thermal fault. A later service-cold inventory started 20 complete model variants, all of which returned exactOK; the full loading-time table is included below.
The first deployment did not produce a slow benchmark. It did not load.
The new official DeepSeek V4 Flash 0731 release replaced the preview checkpoint, but the 102.3GB ROCmFP3-MIX quant exposed a backend gap: qtype 105 had no implementation for the non-zero H32 rotations used by the model’s p4mix experts. The server stopped at layer 3, expert 7. A process that never becomes ready has no honest throughput number.
That failure set the order of work: make the new weights load, measure each cumulative change, and keep testing the answer after the attractive number appears.
The optimisation ladder
Every stage used the same request: 32,512 prompt tokens, temperature zero, target-only batch one, caches disabled and up to 64 output tokens. The experimental profile used sparse prefill and four routed experts. Each row began in a fresh server and had to return exactly OK on its first request.
| Cumulative stage | Startup | 32K prefill | First-request OK |
Decision |
|---|---|---|---|---|
| First deployment | failed | — | — | implement H32 support |
| H32 correctness baseline | 26.794s | 14.58 tok/s | yes | retain |
| Fused H32 expert matvec | 28.783s | 14.61 tok/s | yes | fused basis |
| Shared H32 input | 24.784s | 14.53 tok/s | yes | no standalone gain |
| Fused multi-token H32 prefill | 26.693s | 24.70 tok/s | yes | retain |
| Streaming model loader | 22.722s | 24.71 tok/s | yes | retain |
| Decode specialization | 22.655s | 24.75 tok/s | yes | reject after decode test |
| Monolithic layer-major prefill | 22.689s | 145.49 tok/s | yes | investigate |
| Four host-compute workers | 22.667s | 146.12 tok/s | no | reject |
| Packed24 FP3 Q1 | 32.811s | 145.96 tok/s | no | reject |
| Fastest one-pass configuration | 24.834s | 146.65 tok/s | yes | reject after repeats |
The fused multi-token H32 kernel produced the first useful gain: 69.1%, from 14.61 to 24.70 tok/s. Streaming model loading then reduced startup by 14.9% without claiming an inference improvement.
The large measured step came from monolithic layer-major prefill batching. It moved the same 32K request from 24.71 to 145.49 tok/s, a 5.89-times jump. The best first request reached 146.65 tok/s, or 10.06 times the first working baseline.
Two variants already demonstrated why output checks mattered. Four host-compute workers produced an unrelated instruction and x; the packed24 FP3 selector repeated control text and returned OK.. Both were rejected despite their competitive prompt rates.
Then I repeated the fast result
The remaining sparse profile passed its fresh-server request, but it did not remain correct:
| Sparse four-expert check | 32K prefill | Exact OK |
|---|---|---|
| Fresh-server ladder request | 146.65 tok/s | yes |
| Consecutive request through Lemonade | 147.62 tok/s | no |
| Consecutive direct-backend request | 148.02 tok/s | no |
| Fresh request with graph-reset experiment | 138.01 tok/s | no |
The last experiment explicitly discarded the cached graph at a new request boundary. It still echoed or corrupted prompt material, so the patch was rejected. The important distinction is that the throughput was real while the configuration was not production-safe. One exact answer from one fresh process had been too weak a qualification rule.
That changed the deployment decision. Lemonade on evox3 now defaults to accuracy-ar: exact prefill, all six routed experts, target only, a 32,768-token context and caches off. The uncached production profile processed the same 32,512-token prompt at 17.62 tok/s in 30.75 minutes and returned exact OK through Lemonade. Without restarting the container, it then processed an uncached 16,128-token prompt at 19.75 tok/s in 13.61 minutes and returned exact OK again. That consecutive pass is the behaviour the sparse profile could not sustain.
What the 128K number means
Before the repeat problem appeared, I also ran the fast sparse image once with a 131,072-token maximum. A calibrated 130,816-token prompt completed in 19.78 minutes at 110.22 tok/s and returned OK on that first request.
Manual checks near completion showed about 13–14GiB of available memory and roughly 10.24GiB of GTT in use. Total swap use reached about 728MiB, although evox3 already had roughly 411–504MiB used before or early in the run. This is evidence that the 102.3GB quant can process nearly 128K on the machine; it is not a claim that the sparse profile became repeat-stable at that size.
Decode also received its own test. The proposed specialization managed a 19.6 tok/s median over three measured 512-token completions after a warmup; its parent produced 19.7 tok/s. I rejected the change. Those figures are diagnostic because Radeon performance policy remained at auto.
Running 0731 under Lemonade
Lemonade remains the registry, lifecycle manager and OpenAI-compatible API. The pinned 0731 filename is dispatched to a ROCm 7.14 Lucebox container built from e1cd3c9; every other GGUF still falls through to the existing ROCm llama.cpp backend.
The registered model is DeepSeek-V4-Flash-0731-ROCmFP3-MIX. The 10.8GB DSpark draft is downloaded and hash-verified, but remains opt-in because this ladder did not qualify it. I also pinned ROCm 7.14.0, the Lucebox commit, both Hugging Face revisions and both GGUF hashes.
The lifecycle boundary is tested too: Lemonade unloaded the attached container cleanly, reloaded the exact profile in 23 seconds, and returned exact OK from a short post-reload smoke test. I left the model loaded and healthy on evox3.
How long the installed models take to load
I later audited every deployable model variant I found on evox3, rather than publishing only the current DeepSeek number. These are service-cold measurements: the previous model was unloaded, its backend process was absent, and the clock ran from the load or launch request until the model API reported ready. Tests ran sequentially so each backend had the available accelerator and memory resources.
I did not globally discard the Linux page cache. These figures therefore represent the operational wait after an unload or service start, not a power-cycle or storage-cache-cold boot. The Lemonade registry loads used a 32,768-token context; the direct GGUF sweep used 4,096; the superseded DeepSeek preview used 8,192; FastFlowLM and the qualified vLLM launch retained their runtime profiles. That makes this an operations table, not a claim that unlike backends have been compared under one inference workload.
Registered and service-format models
| Model | Serving path | Ready | API check | Result |
|---|---|---|---|---|
| Tiny test GGUF | Lemonade / ROCm 7.14 | 0.715s | 0.063s | exact OK |
| Qwen3 Coder 30B-A3B Q4_K_S | Lemonade / ROCm 7.14 | 7.324s | 0.177s | exact OK |
| Qwen3.5 122B-A10B split Q4_K_XL | Lemonade / ROCm 7.14 | 38.211s | 0.352s | exact OK; thinking disabled for the visible-answer check |
| DeepSeek V4 Flash 0731 ROCmFP3-MIX | Lemonade / Lucebox ROCm 7.14 | 27.535s | 0.847s | exact OK |
| Qwen3.5 0.8B NPU2 | FastFlowLM / NPU | 3.044s | 0.509s | exact OK |
| Qwen3.5 4B NPU2 | FastFlowLM / NPU | 4.417s | 1.310s | exact OK |
| Qwen3.6 35B-A3B NPU2 | FastFlowLM / NPU | 16.611s | 2.865s | exact OK |
| Phi-3.5 Mini production package | NPU prefill / GPU decode | 15.470s | 20.600s | exact OK when isolated |
| Qwen3.5 122B-A10B GPTQ Int4 | vLLM / ROCm 7.14 | 73.522s | 0.505s | exact OK |
| Superseded DeepSeek V4 Flash preview | Lucebox / ROCm 7.14 | 32.707s | 0.997s | exact OK |
Retained GGUF sweep and alternate representations
| Model artefact | Ready | API check | Result |
|---|---|---|---|
| Qwen3.5 0.8B Q4_K_XL | 1.551s | 0.130s | exact OK |
| Qwen3.5 2B Q4_K_XL | 1.553s | 0.104s | exact OK |
| Qwen3.5 4B Q4_K_XL | 2.062s | 0.139s | exact OK |
| Qwen3.5 9B Q4_K_XL | 3.448s | 0.149s | exact OK |
| Qwen3.5 27B Q4_K_XL | 10.189s | 0.427s | exact OK |
| Qwen3.5 35B-A3B Q4_K_XL | 8.829s | 0.180s | exact OK |
| Qwen3.5 397B-A17B IQ1_M | 66.067s | 0.586s | exact OK |
| Qwen3.5 122B-A10B consolidated Q4_K_XL | 35.574s | 0.364s | exact OK |
| Qwen3.5 0.8B F16 | 1.547s | 0.143s | exact OK |
| Qwen3.5 0.8B BF16 | 1.547s | 0.114s | exact OK |
That is 20/20 complete artefacts loaded and functionally checked. A twenty-first Lemonade registry name, Qwen3-Coder-30B-A3B-Instruct-GGUF, failed in 0.418 seconds because its Hugging Face cache contained a ref but no weights. I do not count that as a corrupt model: the complete local Q4_K_S representation is the 7.324-second row above and works correctly.
The 22.212-second DeepSeek figure in the lifecycle section and the 27.535-second figure in this table answer slightly different questions. The former is the median of six reloads within one fixed lifecycle test; the latter is the single service-cold observation in the sequential cross-model inventory. Both protocols are recorded rather than combining them into a misleading average.
After this audit I changed Lemonade’s persistent default from Vulkan to ROCm 7.14 and repeated two backend-free loads. Qwen3 Coder became ready in 7.385 seconds, 0.8% from its audit result; DeepSeek 0731 became ready in 27.736 seconds, 0.7% from its audit result. Both again returned exact OK, so the default-backend change introduced no observed cold-load regression beyond ordinary run-to-run variation.
The Phi result also exposed an operating boundary. Phi works by itself, but issuing a Phi generation while the roughly 97GB DeepSeek process is resident exhausts the 128GB machine and invokes the kernel OOM killer. I therefore operate those two services one at a time; a health endpoint alone is not evidence that they are safe to use concurrently.
The exact machine-readable results are available as CSV.
I looked for memory leakage
I then kept the exact profile in one Lemonade process for a 28-minute allocation soak. The sequence was 100 identical short requests, a 256→1K→2K→4K→8K context ramp, followed by 4K→2K→1K→8K, another 100 short requests, and a 30-second idle settle. One-second telemetry produced 1,623 samples. All 209/209 responses were exact OK.
| Signal | Start | Worst observed | Final | Result |
|---|---|---|---|---|
| Available RAM | 23.489GiB | 23.290GiB minimum | 23.720GiB | +236.8MiB vs start |
| Container cgroup | 97.060GiB | +6.75MiB | +5.36MiB | bounded |
| GTT | 519.7MiB | 565.7MiB | 565.7MiB | one 46MiB high-water step |
| Swap free | 7.538GiB | no decrease | +3.92MiB | no new swap consumption |
| Short-request median | 22.1136 tok/s | — | 22.0802 tok/s | -0.151% |
The first and second 8K requests measured 20.8234 and 20.8270 tok/s. GTT did not grow on the second run or during the final 100 requests. That makes the retained 46MiB look like a bounded context-workspace high-water allocation, not a per-request leak.
I followed with six complete Lemonade unload/reload cycles. After every unload and ten-second settle, container cgroup memory was zero and GTT was exactly 18,620,416 bytes. Unloaded available RAM ended 97.2MiB higher in cycle six than cycle one. Every reload became ready and returned exact OK; median unload and load times were 2.510s and 22.212s.
Across 215 requests and 32.16 minutes, I found no monotonic memory-loss signal or orphaned container. That is bounded evidence, not proof that a leak cannot emerge during an overnight or multi-day service lifetime. The earlier same-process 32K→16K qualification covers larger context; this soak deliberately prioritised repeated allocation and lifecycle boundaries up to 8K.
Four hours at the 32K production limit
The allocation test answered the repeated-request question, but it did not hold the production profile near its context ceiling or at full GPU load for hours. I therefore followed it with eight back-to-back, uncached 32,512-token requests using exact prefill and all six routed experts. The load phase ran for 4.089 hours, followed by a 60-second idle settle. All 8/8 requests returned HTTP 200 and exact OK.
| Signal | Sustained result | What changed over time |
|---|---|---|
| 32K prefill | 17.6716 tok/s median | second half was 0.017% faster |
| GPU busy | 99.92% mean | every post-warmup sample ≥95% |
| GPU SCLK | 2,898MHz mean | 2,895MHz fifth percentile |
| PPT power | 98.4W mean | 101.0W p95; 105.1W maximum |
| GPU edge temperature | 69.6°C mean | 71°C p95; 73°C maximum |
The eight results ranged from 17.6511 to 17.6799 tok/s, with a coefficient of variation of only 0.045%. A fitted trend was slightly positive at +0.0024 tok/s per hour. In other words, this run contains no sign of progressive prefill degradation.
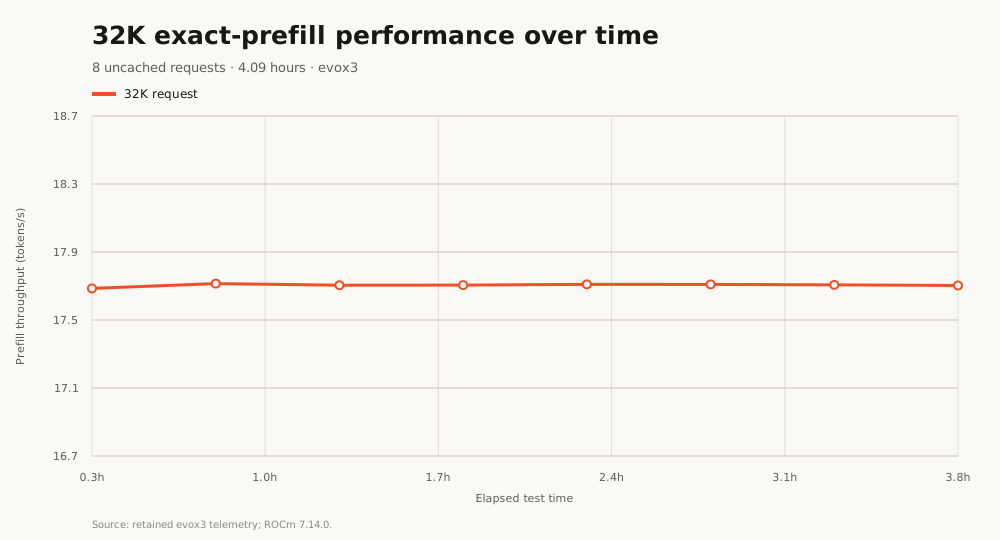
Prefill throughput remained flat across all eight production-profile requests.
The first request raised GTT by 190MiB, from 515.7 to 705.7MiB, as the 32K workspace reached its high-water mark. GTT was then byte-for-byte flat: its late 30-minute median equalled the median after that first request. Container cgroup memory differed by only 1.08MiB between the post-first-request and late medians. Available RAM fluctuated in both directions: its late median was 10.7MiB higher than just after the first request, while the post-settle reading was 336.2MiB below the initial sample. That system-wide measure was non-monotonic while the process cgroup and GTT plateaued. Swap free increased by 8.30MiB; VRAM changed by 4KiB.
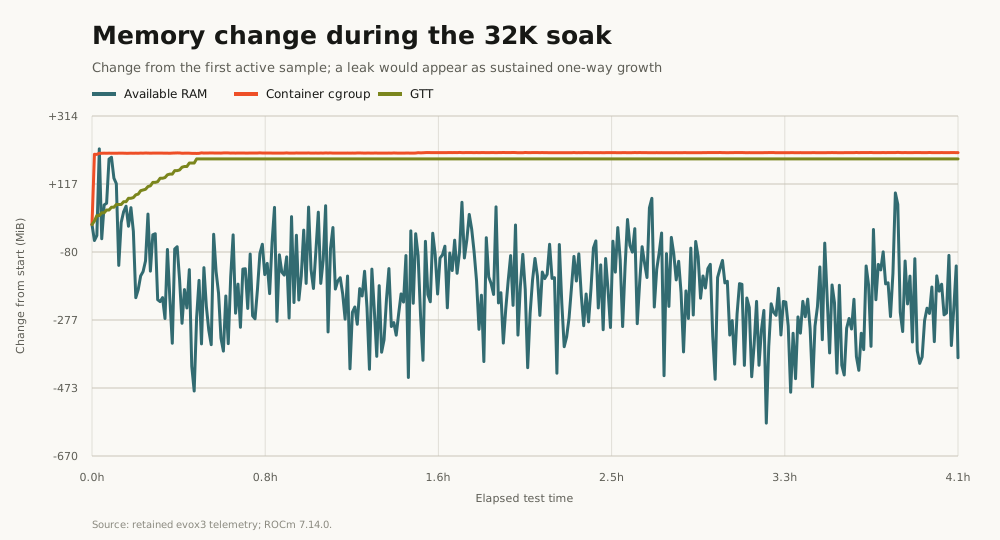
The retained GTT allocation is a bounded workspace plateau, not request-by-request growth.
One-second telemetry recorded 14,490 GPU samples. GPU busy averaged 99.92%, package power averaged 98.4W and the edge temperature averaged 69.6°C. Temperature peaked at 73°C, below the test’s predefined 90°C abort threshold, while the clock held near 2.9GHz.
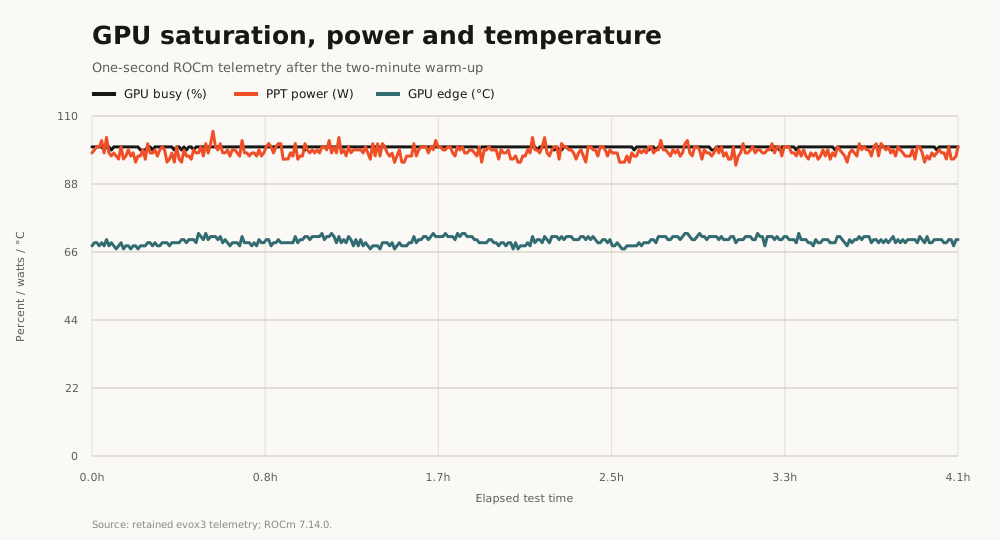
The GPU stayed saturated without a rising temperature trend or clock collapse.
ECC correctable, deferred and uncorrectable counts did not change. Kernel and server logs contained no GPU fault, reset, OOM, segmentation fault or thermal-throttle report. PROCHOT, sustained-power, slow-package-power, GPU-thermal and SoC-thermal counters remained zero. For completeness, the SMU residency counters recorded 1.977ms of fast-package-power residency and 1.208ms of core-thermal residency when converted using the 3,579,545Hz PM timer. These aggregate residencies were negligible, while the separate throughput and clock series showed no degradation across 4.089 hours.
So this longer test found no progressive memory-leak signal, performance degradation or thermal problem under sustained 32K production load. It remains bounded evidence: four hours cannot rule out a failure that needs days to emerge.
The useful result is therefore more nuanced than “10× faster”. DeepSeek V4 Flash 0731 now loads and runs under Lemonade on evox3; the sparse path established a compelling performance ceiling; repeated requests exposed a correctness boundary; the production default moved back to the slower exact path; and that exact service stayed stable through both a 215-request allocation test and a 4.09-hour saturated 32K soak. That is the optimisation outcome I would rather operate—and publish.
For the host and runtime choices behind this deployment, see ROCm on Strix Halo without folklore.